
Resident generated news about Lakewood, Colorado
Resident generated news about Lakewood, Colorado
High Turnout But Otherwise Normal Election
The high turnout April 7, 2026 was a surprise for a special election, especially since the election was about a normally boring topic like zoning. In most ways, the special election turnout and demographics mirrored the last two city elections, which is only surprising because so many people thought there would be something “special” about the vote.
Key takeaways include:
- Lakewood is not as progressive as its Council
- People vote more when they think it matters
- Unopposed Council Members are vulnerable
- Voter turnout was higher than expected
- Generation voting rates followed historic patterns
Lakewood is not as progressive as its Council
Lakewood City Council was very proud of all the progressive accomplishments made through the new zoning. But, although many City Council Members welcome the “progressive” label, Lakewood voters do not self-identify as such.
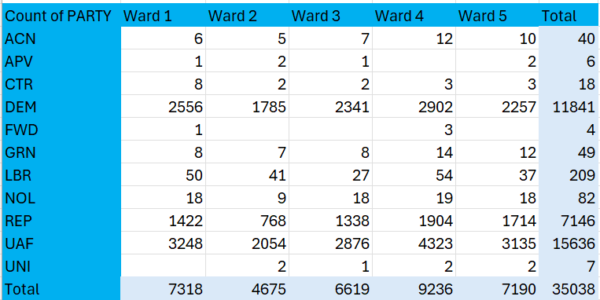
The table below shows party affiliation for voters in the special election. Most are unaffiliated, which aligns with overall Lakewood voter registration. According to this data, there really was no reason to think people would agree to a radical, progressive rezoning once they knew what was actually occurring.
City Council does not align with the people.
People Vote When They Think It Matters
The chart below shows voter turnout by ward. Notice that more people voted in the special election than voted in the 2025 Ward 1 and 2 City Councilor elections. Ward 1 and 2 candidates ran unopposed, causing many people not to vote.
This data shows that people will vote when they think it matters.
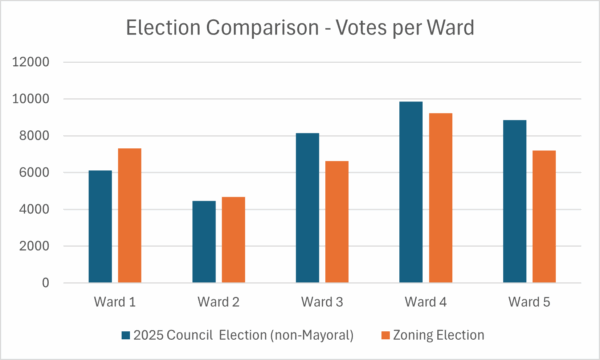
In the graph above, Ward 5 shows a 19% drop in turnout, which may be attributable to change minimizations requested by the Ward 5 Councilors, or to the belief that the HOAs would minimize impacts.
Ward 3 also showed a 19% drop in turnout. Ward 3 was the only Ward without a tight-knit, neighborhood group actively campaigning for a “vote yes”. This shows neighborhood engagement definitely matters.
Unopposed Council Members are Vulnerable
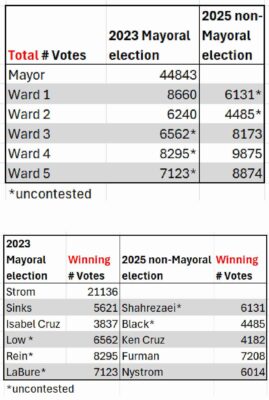
The graph above also suggests that Councilors Jeslin Shahrezaei (Ward 1) and Liz Black (Ward 2) are in vulnerable positions, having been elected unopposed in non-Mayoral elections and now standing in opposition to their constituents’ clear choice in the special election. Wards 1 and 2 are the only 2 Wards that had more votes in the special election than in the Ward election.
Councilors Low (Ward 3), Rein (Ward 4) and LaBure (Ward 5) also ran unopposed in 2023 but received higher turnout due to it being a Mayoral election.
Voter Turnout Higher Than Expected
Midterm elections get lower voter participation than Presidential elections. The same can be applied to Lakewood.
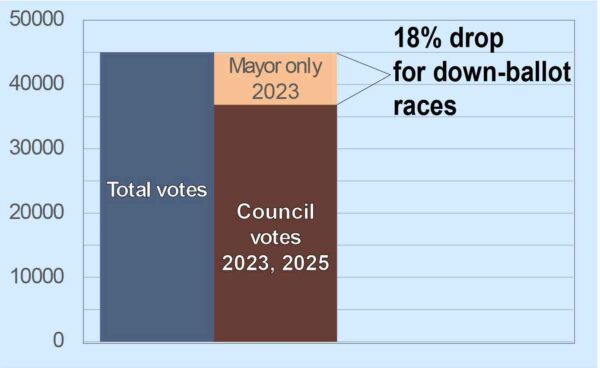
Lakewood had 44,842 people vote in the last Mayoral race compared to 37,538 voters in the next non-mayoral 2025 election. However, even in the 2023 Mayor race, about 8,000 people voted only for a Mayor, not any ward candidate. This represents a 20% decrease in down-ballot races.
That means that even given the opportunity, about 20% less people vote for Council Members compared to Mayor.
Compared to the number of people who vote for President or Mayor, every Council seat was “low turnout”, but no one suggests they are not valid results.
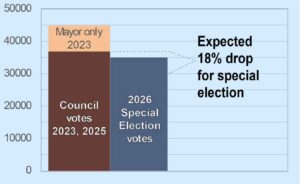
Realistically, the April 7 special election could have seen another 20% drop in voter. It did not.
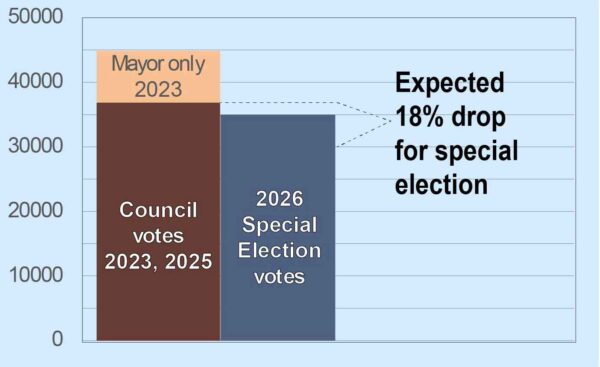
As first reported by Steve F on nextdoor.com, the April 7, 2026 special election actually had 95% voter turnout compared to the last two votes for non-Mayoral Council positions.
Contrary to being low turnout, for a special election this was high turnout. When Lakewood residents get motivated enough to petition, they also turn out to vote.
The “low turnout” narrative started as far back as November 2025, when a campaign finance complaint was filed by the pro-zoning “vote no” group. During the resultant hearing, the “vote no” group raised concerns about how referendums allowed a small number of voices to dominate the landscape. They also expressed worry about voter turnout in the upcoming election.
Council Members are still parroting the low turnout excuse, which is ironic since they all got elected by similar turnout.
Steve F had similar findings: “Considering the so-called ‘low-turnout’, there were also more YES ballots cast on April 7 than Mayor Wendi Strom received when elected on Nov 7, 2023! Strom was actually elected with less than 50% of the votes cast for mayor! She truly does not represent a majority of the voters.”
Note: the last mayor race was a key reason residents are asking not to split the vote next time.
Elections and Surveys
City surveys routinely yield results from a very small number of people yet city leaders rely on them for multiple policy decisions. The most recent city survey was applauded for its high participation – a whole 650 completed surveys, up from 486.
No matter if it’s an election or a survey, 10 people or 1000, results are discounted unless people agree with them. Approving the first section of the zoning code was done, in part, because of a handful of supporters at the August 25, 2025, meeting. The special election results show the importance of moving outside personal bubbles.
Generation voting rates followed historic patterns
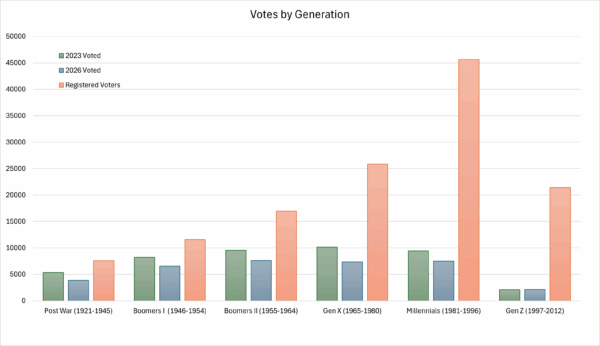
Each generation voted as much as they did to elect City Council in the first place. The graph below shows the zoning election turnout in blue, and the last, slightly larger, mayoral election in green.
This is the usual pattern for voting and should be completely expected by any City leader that knows their constituents.
Although it is impossible to know the number of people in each generation that voted yes or no, each has faced housing challenges. For example, high mortgage rates, inflation, and recessions, all of which affected housing prices.
Summary
Turnout was very high for a special election, especially considering that zoning is usually a boring, low-interest issue. City Council might have been counting on zoning being boring enough that people would not pay attention. Instead, residents were highly engaged and voted almost as much in the special election as they did for their City Council representatives.
The data shows people vote when they think it matters and when they get relevant information from neighbors. Votes by age group appeared the same as the last mayoral election. No single generation dominated the vote.
When all else is equal, the resulting voter turnout could have been predicted from the demographics. Which way people voted depended on which message was heard. In this case, the special interest money was effectively countered by the grassroots passion so that both sides had an equally amplified message.